Exploratory analysis with modality#
Generating rapid and sufficiently deep exploratory analyses of complex datasets is an important part of the analysis workflow. Here we demonstrate how modality enables such analysis with a few key examples.
Load data#
For the purposes of this demo we can use a duet +modC dataset of Genome in a bottle (GIAB) samples. These data are publicly available and can be loaded using the load_biomodal_dataset(). This will pull the dataset and load it in to our session as a ContigDataset object.
from modality import load_biomodal_dataset
ds = load_biomodal_dataset("giab")
ds
<xarray.Dataset> Size: 25GB
Dimensions:                         (pos: 58589250, sample_id: 14)
Coordinates:
    contig                          (pos) <U20 5GB dask.array<chunksize=(80000,), meta=np.ndarray>
    group                           (sample_id) <U22 1kB dask.array<chunksize=(14,), meta=np.ndarray>
    ref_position                    (pos) uint32 234MB dask.array<chunksize=(80000,), meta=np.ndarray>
  * sample_id                       (sample_id) <U22 1kB 'CEG1530-EL01-A1200-...
    strand                          (pos) <U2 469MB dask.array<chunksize=(80000,), meta=np.ndarray>
    trinucleotide_context           (pos) uint8 59MB dask.array<chunksize=(80000,), meta=np.ndarray>
    Input DNA Quantity (ng/sample)  (sample_id) int64 112B 80 80 80 ... 80 80 80
    Protocol Version                (sample_id) object 112B '5-Letter v2.4' ....
    giab_id                         (sample_id) object 112B 'HG001' ... 'HG007'
    NA_id                           (sample_id) object 112B 'NA12878' ... 'NA...
    family                          (sample_id) object 112B 'Utah' ... 'Han C...
    family_status                   (sample_id) object 112B 'Singleton' ... '...
    sex                             (sample_id) object 112B 'Female' ... 'Fem...
    tech_replicate_number           (sample_id) int64 112B 1 1 1 1 1 ... 2 2 2 2
Dimensions without coordinates: pos
Data variables:
    num_c                           (pos, sample_id) uint32 3GB dask.array<chunksize=(80000, 14), meta=np.ndarray>
    num_modc                        (pos, sample_id) uint32 3GB dask.array<chunksize=(80000, 14), meta=np.ndarray>
    num_n                           (pos, sample_id) uint32 3GB dask.array<chunksize=(80000, 14), meta=np.ndarray>
    num_other                       (pos, sample_id) uint32 3GB dask.array<chunksize=(80000, 14), meta=np.ndarray>
    num_total                       (pos, sample_id) uint32 3GB dask.array<chunksize=(80000, 14), meta=np.ndarray>
    num_total_c                     (pos, sample_id) uint32 3GB dask.array<chunksize=(80000, 14), meta=np.ndarray>
Attributes: (100/205)
    context:                     CG
    context_encoding:            {'0': 'AAA', '1': 'AAC', '10': 'AGA', '100':...
    contigs:                     ['chr1', 'chr2', 'chr3', 'chr4', 'chr5', 'ch...
    coordinate_basis:            0
    fasta_path:                  GRCh38Decoy.fa
    input_path:                  ['CEG1530-EL01-A1200-001.genome.GRCh38Decoy_...
    quant_subtype:               modC
    ref_name:                    GRCh38Decoy
    sample_ids:                  ['CEG1530-EL01-A1200-001', 'CEG1530-EL01-A12...
    slice_chr1:                  slice(0, 4750318, 1)
    slice_chr10:                 slice(29992404, 32770360, 1)
    slice_chr11:                 slice(32770360, 35436588, 1)
    slice_chr11_KI270721v1_ran:  slice(58346764, 58353552, 1)
    slice_chr12:                 slice(35436588, 38068524, 1)
    slice_chr13:                 slice(38068524, 39753462, 1)
    slice_chr14:                 slice(39753462, 41478318, 1)
    slice_chr14_GL000009v2_ran:  slice(58353552, 58356510, 1)
    slice_chr14_GL000194v1_ran:  slice(58367306, 58371510, 1)
    slice_chr14_GL000225v1_ran:  slice(58356510, 58364148, 1)
    slice_chr14_KI270722v1_ran:  slice(58364148, 58367306, 1)
    slice_chr14_KI270723v1_ran:  slice(58371510, 58372706, 1)
    slice_chr14_KI270724v1_ran:  slice(58372706, 58373814, 1)
    slice_chr14_KI270725v1_ran:  slice(58373814, 58377018, 1)
    slice_chr14_KI270726v1_ran:  slice(58377018, 58378050, 1)
    slice_chr15:                 slice(41478318, 43290370, 1)
    slice_chr15_KI270727v1_ran:  slice(58378050, 58385978, 1)
    slice_chr16:                 slice(43290370, 45592152, 1)
    slice_chr16_KI270728v1_ran:  slice(58385978, 58417328, 1)
    slice_chr17:                 slice(45592152, 48088808, 1)
    slice_chr17_GL000205v2_ran:  slice(58417328, 58421074, 1)
    slice_chr17_KI270729v1_ran:  slice(58421074, 58434438, 1)
    slice_chr17_KI270730v1_ran:  slice(58434438, 58439104, 1)
    slice_chr18:                 slice(48088808, 49600836, 1)
    slice_chr19:                 slice(49600836, 51714166, 1)
    slice_chr1_KI270706v1_rand:  slice(58305782, 58308960, 1)
    slice_chr1_KI270707v1_rand:  slice(58308960, 58309582, 1)
    slice_chr1_KI270708v1_rand:  slice(58309582, 58311688, 1)
    slice_chr1_KI270709v1_rand:  slice(58311688, 58314576, 1)
    slice_chr1_KI270710v1_rand:  slice(58314576, 58315010, 1)
    slice_chr1_KI270711v1_rand:  slice(58315010, 58315764, 1)
    slice_chr1_KI270712v1_rand:  slice(58315764, 58321998, 1)
    slice_chr1_KI270713v1_rand:  slice(58321998, 58323728, 1)
    slice_chr1_KI270714v1_rand:  slice(58323728, 58326038, 1)
    slice_chr2:                  slice(4750318, 9135658, 1)
    slice_chr20:                 slice(51714166, 53261120, 1)
    slice_chr21:                 slice(53261120, 54118812, 1)
    slice_chr22:                 slice(54118812, 55320596, 1)
    slice_chr22_KI270731v1_ran:  slice(58439104, 58444066, 1)
    slice_chr22_KI270732v1_ran:  slice(58444066, 58445036, 1)
    slice_chr22_KI270733v1_ran:  slice(58445036, 58458626, 1)
    ...                          ...
    slice_chrUn_KI270511v1:      slice(58497958, 58498048, 1)
    slice_chrUn_KI270512v1:      slice(58495674, 58496040, 1)
    slice_chrUn_KI270515v1:      slice(58498048, 58498130, 1)
    slice_chrUn_KI270516v1:      slice(58495658, 58495674, 1)
    slice_chrUn_KI270517v1:      slice(58498208, 58498232, 1)
    slice_chrUn_KI270518v1:      slice(58495590, 58495616, 1)
    slice_chrUn_KI270519v1:      slice(58496040, 58497818, 1)
    slice_chrUn_KI270521v1:      slice(58503334, 58503486, 1)
    slice_chrUn_KI270522v1:      slice(58497818, 58497958, 1)
    slice_chrUn_KI270528v1:      slice(58498280, 58498480, 1)
    slice_chrUn_KI270529v1:      slice(58498232, 58498280, 1)
    slice_chrUn_KI270530v1:      slice(58498480, 58498550, 1)
    slice_chrUn_KI270538v1:      slice(58498706, 58500118, 1)
    slice_chrUn_KI270539v1:      slice(58498550, 58498706, 1)
    slice_chrUn_KI270544v1:      slice(58500118, 58500156, 1)
    slice_chrUn_KI270548v1:      slice(58500156, 58500206, 1)
    slice_chrUn_KI270579v1:      slice(58500396, 58500822, 1)
    slice_chrUn_KI270580v1:      slice(58500258, 58500282, 1)
    slice_chrUn_KI270581v1:      slice(58500282, 58500396, 1)
    slice_chrUn_KI270582v1:      slice(58501506, 58501632, 1)
    slice_chrUn_KI270583v1:      slice(58500206, 58500228, 1)
    slice_chrUn_KI270584v1:      slice(58501452, 58501506, 1)
    slice_chrUn_KI270587v1:      slice(58500228, 58500258, 1)
    slice_chrUn_KI270588v1:      slice(58501632, 58501714, 1)
    slice_chrUn_KI270589v1:      slice(58500822, 58501400, 1)
    slice_chrUn_KI270590v1:      slice(58501400, 58501452, 1)
    slice_chrUn_KI270591v1:      slice(58501758, 58501824, 1)
    slice_chrUn_KI270593v1:      slice(58501714, 58501758, 1)
    slice_chrUn_KI270741v1:      slice(58527454, 58530832, 1)
    slice_chrUn_KI270742v1:      slice(58577282, 58580106, 1)
    slice_chrUn_KI270743v1:      slice(58534754, 58538928, 1)
    slice_chrUn_KI270744v1:      slice(58538928, 58542900, 1)
    slice_chrUn_KI270745v1:      slice(58542900, 58544164, 1)
    slice_chrUn_KI270746v1:      slice(58544164, 58544974, 1)
    slice_chrUn_KI270747v1:      slice(58544974, 58551808, 1)
    slice_chrUn_KI270748v1:      slice(58551808, 58554798, 1)
    slice_chrUn_KI270749v1:      slice(58554798, 58557634, 1)
    slice_chrUn_KI270750v1:      slice(58557634, 58560304, 1)
    slice_chrUn_KI270751v1:      slice(58560304, 58562536, 1)
    slice_chrUn_KI270752v1:      slice(58562536, 58563006, 1)
    slice_chrUn_KI270753v1:      slice(58563006, 58564600, 1)
    slice_chrUn_KI270754v1:      slice(58564600, 58567958, 1)
    slice_chrUn_KI270755v1:      slice(58567958, 58569060, 1)
    slice_chrUn_KI270756v1:      slice(58569060, 58573120, 1)
    slice_chrUn_KI270757v1:      slice(58573120, 58573972, 1)
    slice_chrX:                  slice(55320596, 57966014, 1)
    slice_chrY:                  slice(57966014, 58304912, 1)
    slice_chrY_KI270740v1_rand:  slice(58479294, 58479884, 1)
    zarr_version:                0.1
description: A +modC dataset of human Genome in a bottle ...This is the ContigDataset, the main modality object, which is a multi-dimensional array following the xarray.Dataset format. The two dimensions here are position and sample. For each of the 7 GIAB samples, we have two technical replicates, so 14 samples in total.
An initial investiagtion of a dataset#
A common goal for initial exploratory anlysis for a set of samples is to understand how they relate to each other. In terms of initial quality control (QC) this can help one indentify any potential issues, such as sample-swaps, very early in the analysis process. It can also give us some initial understanding of the underlying biology and help shape dowstream investigation. Below we go through a few examples of how modality can be used for these kind of initial investiagtions.
The functionality shown here can be used genome-wide but for brevity we will subset our dataset to a single chromosome. We can use the slice functionality of the ContigDataset to extract a single chromosome view of the data and work with this downstream.
ds = ds["chr2"]
Pearson correlation across samples#
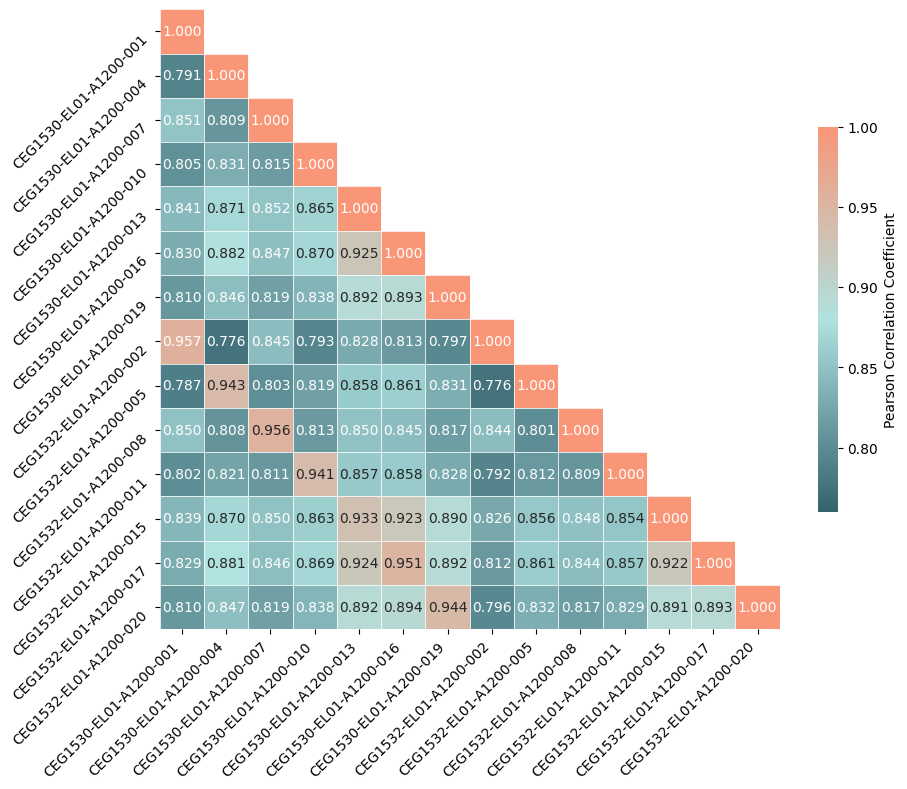
One such primary analysis is to calculate the pearson correlation coefficients between pairs of samples in the dataset. This helps to summarise similarity between samples and can also flag potential issues, such as duplicated samples. This can be efficiently done using the compute_pearson_matrix method of the ContigDataset. This method calculates methylation fractions between numerator and denominator arguments and then calculates the pearson correlation coefficients across the captured genomic range (in this case chromosome 2) between each pair of samples and returns the resulting matrix. This method can be used as is, or one can use the sister method: plot_pearson_matrix(), which uses compute_pearson_matrix internally but returns a seaborn.heatmap visualisation of the result.
pearson_matrix = ds.compute_pearson_matrix(
    numerator="num_modc",
    denominator="num_total_c",
    min_coverage=15,
)
fig, axes = ds.plot_pearson_matrix(
    numerator="num_modc",
    denominator="num_total_c",
    min_coverage=15,
)
PCA analysis#
We may also wish to perfom a principal components analysis to help us understand the structure of the dataset. Here we can make use of the pca module in modality.analysis.
from modality.analysis import run_pca, plot_pca_scree, plot_pca_scatter
We first calculate methylation fractions across the dataset, using the assign_fractions method of the ContigDataset, so we can then use a methylation fraction feature for our pca analysis
ds.assign_fractions(
    numerators="num_modc",
    denominator="num_total_c",
    min_coverage=15,
    inplace=True,
)
pca_object, transformed_data = run_pca(
    input_array=ds.frac_modc,
    n_components=2,
)
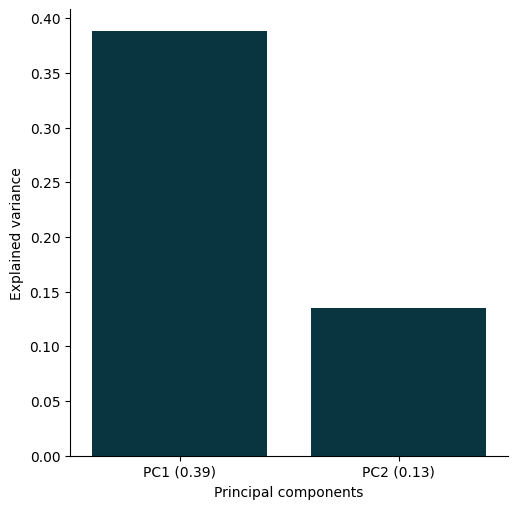
You can quickly generate a scree plot to visualise the variance explained by each principal component:
plot_pca_scree(
    pca_object=pca_object,
)
<seaborn.axisgrid.FacetGrid at 0x33adb1250>
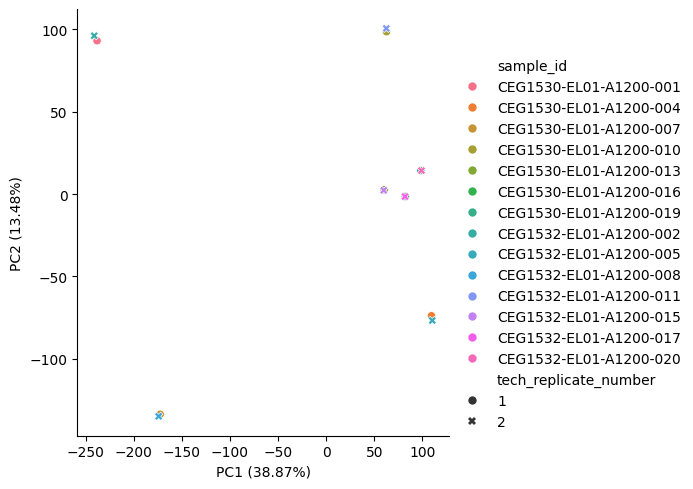
You can also generate a scatter plot to show how the samples are structured along any two principal components. For example, to check that technical replicates group as expected with their coupled samples.
plot_pca_scatter(
    pca_object=pca_object,
    pca_result=transformed_data,
    hue=ds.sample_id,
    style=ds.tech_replicate_number,
)
<seaborn.axisgrid.FacetGrid at 0x341106990>
Restricting the dataset to a single trio#
Here we show how to only select part of the dataset. We focus on the GIAB Han Chinese Trio
HG005 is the son
HG006 is the father
HG007 is the mother
Each member of the trio has two replicates, so we will also sum over the replicates to gain some coverage.
# Filter to Han Chinese trio
ds_trio = ds.where(ds.family == "Han Chinese", drop=True)
# Sum the counts for each trio
ds_trio = ds_trio.aggregate_bygroup("giab_id", "sum")
# Rename the index to sample_id for compatibility with the ContigDataset
ds_trio = ds_trio.drop_vars("sample_id")
ds_trio = ds_trio.rename({"giab_id": "sample_id"})
ds_trio
<xarray.Dataset> Size: 1GB
Dimensions:                         (pos: 4385340, sample_id: 3)
Coordinates:
    contig                          (pos) <U20 351MB dask.array<chunksize=(49682,), meta=np.ndarray>
    ref_position                    (pos) uint32 18MB dask.array<chunksize=(49682,), meta=np.ndarray>
    strand                          (pos) <U2 35MB dask.array<chunksize=(49682,), meta=np.ndarray>
    trinucleotide_context           (pos) uint8 4MB dask.array<chunksize=(49682,), meta=np.ndarray>
  * sample_id                       (sample_id) object 24B 'HG005' ... 'HG007'
    group                           (sample_id) <U46 552B 'CEG1530-EL01-A1200...
    Input DNA Quantity (ng/sample)  (sample_id) <U2 24B '80' '80' '80'
    Protocol Version                (sample_id) <U13 156B '5-Letter v2.4' ......
    NA_id                           (sample_id) <U7 84B 'NA24631' ... 'NA24695'
    family                          (sample_id) <U11 132B 'Han Chinese' ... '...
    family_status                   (sample_id) <U6 72B 'Son' 'Father' 'Mother'
    sex                             (sample_id) <U6 72B 'Male' 'Male' 'Female'
    tech_replicate_number           (sample_id) <U4 48B '1::2' '1::2' '1::2'
Dimensions without coordinates: pos
Data variables:
    num_c                           (pos, sample_id) int64 105MB dask.array<chunksize=(49682, 1), meta=np.ndarray>
    num_modc                        (pos, sample_id) int64 105MB dask.array<chunksize=(49682, 1), meta=np.ndarray>
    num_n                           (pos, sample_id) int64 105MB dask.array<chunksize=(49682, 1), meta=np.ndarray>
    num_other                       (pos, sample_id) int64 105MB dask.array<chunksize=(49682, 1), meta=np.ndarray>
    num_total                       (pos, sample_id) int64 105MB dask.array<chunksize=(49682, 1), meta=np.ndarray>
    num_total_c                     (pos, sample_id) int64 105MB dask.array<chunksize=(49682, 1), meta=np.ndarray>
    frac_modc                       (pos, sample_id) float64 105MB dask.array<chunksize=(49682, 1), meta=np.ndarray>
Attributes:
    context:            CG
    context_encoding:   {'0': 'AAA', '1': 'AAC', '10': 'AGA', '100': 'TAA', '...
    contigs:            ['chr2']
    coordinate_basis:   0
    description:        A +modC dataset of human Genome in a bottle (GIAB) sa...
    fasta_path:         GRCh38Decoy.fa
    frac_denominator:   num_total_c
    frac_min_coverage:  15
    grouped_on:         giab_id
    input_path:         ['CEG1530-EL01-A1200-001.genome.GRCh38Decoy_primary_a...
    quant_subtype:      modC
    ref_name:           GRCh38Decoy
    sample_ids:         ['CEG1530-EL01-A1200-001', 'CEG1530-EL01-A1200-004', ...
    slice_chr2:         slice(0, 4385340, 1)
zarr_version: 0.1Heatmap of methylation fraction between samples#
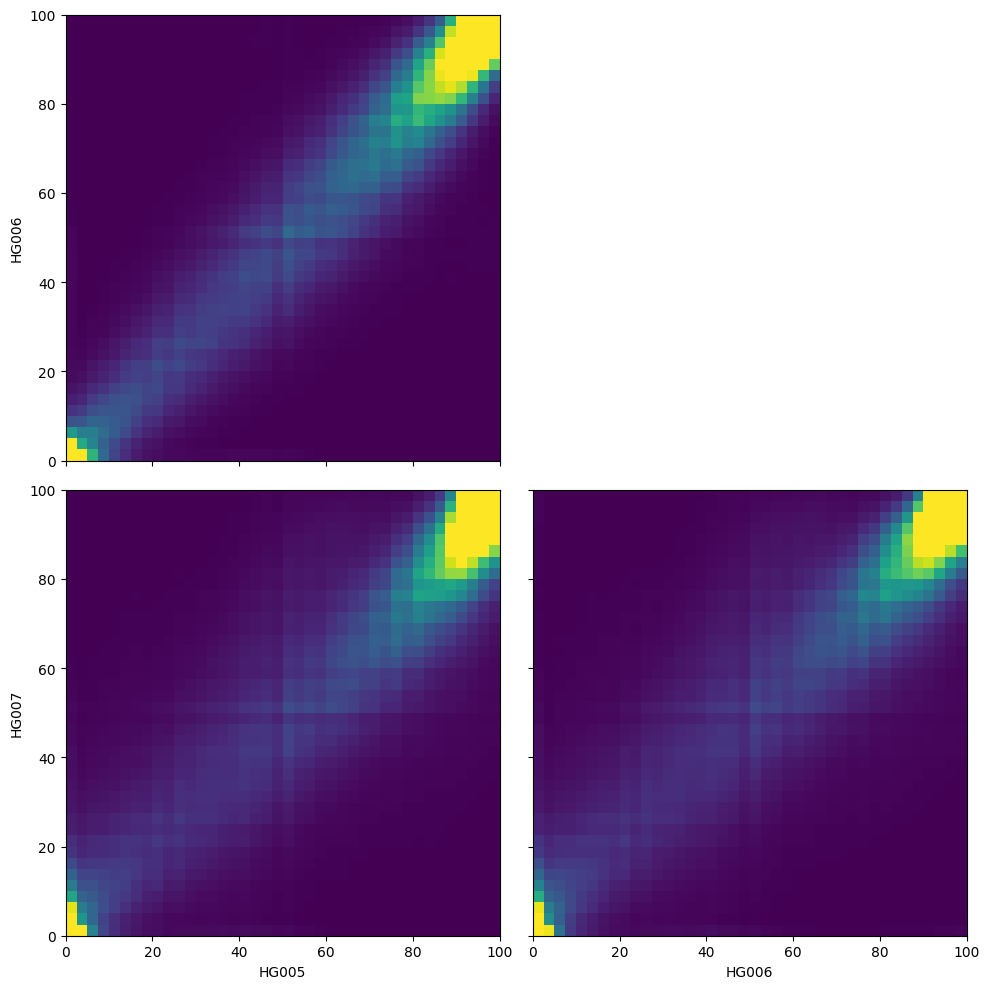
We can get a more nuanced view of the correaltion between samples by plotting a heatmap of methylation fractions between pairs of samples using the plot_correlation_heatmaps() method of the ContigDataset.
fig, axes = ds_trio.plot_correlation_heatmaps(
    numerator="num_modc",
    denominator="num_total_c",
    min_coverage=15,
)
Scatter plot of methylation fraction between samples#
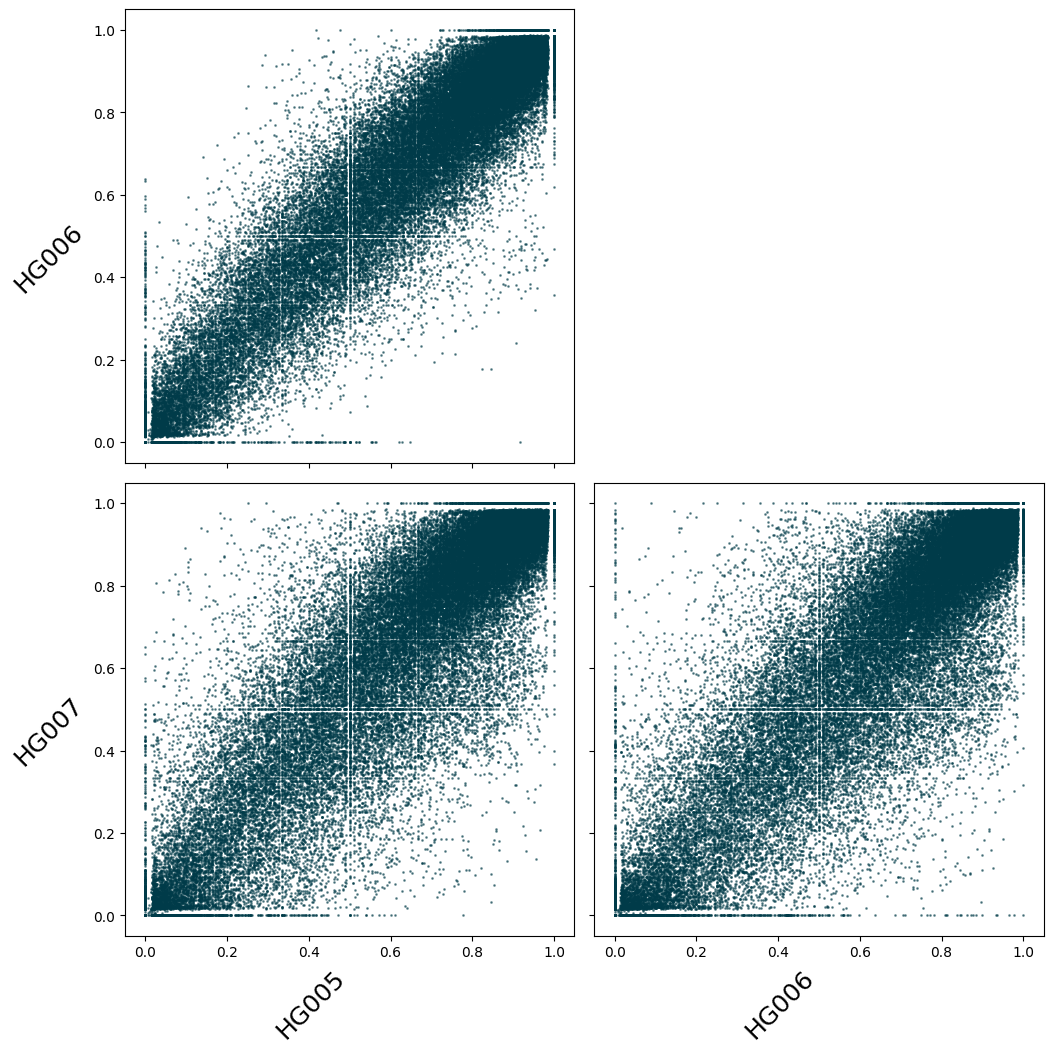
Here we show a scatter plot of the methylation fraction across samples. Because it would represent too many points otherwise, we restrict our dataset to plot only the CpGs between the genomic positions 0 and 2,000,000 of Chromosome 2 using the following syntax: ds_trio["chr2:0-2_000_000"].
Note: Each plotting function returns a fig and axes object. You can then make adjustments to the figures as you see fit. For instance, below we increase the font size and rotate the axis.
fig, axes = ds_trio["chr2:0-2_000_000"].plot_correlation_scatter(
    numerator="num_modc",
    denominator="num_total_c",
    min_coverage=15,
    s=1,
)
for ax in axes:
    for k in range(2):
        ax[k].set_xlabel(ax[k].get_xlabel(), fontsize=18, rotation=45, ha="right")
        ax[k].set_ylabel(ax[k].get_ylabel(), fontsize=18, rotation=45, ha="right")
